

DIYWallST Weekly Recap & Market Forecast $SPX (June 1st—> June 6th)
Stock Market Outlooks, Earning Calendars, WallStreetBets, Economic Calendar, Stock Market Recap, $SPX, Crypto, BTC, DIY Investing


👋 Hello Investors! 🌟
Markets came roaring back from the Memorial Day break, shrugging off mixed trade signals and volatile headlines to end the week solidly higher. A delay in EU tariff implementation, strong tech earnings, and cooling inflation data all helped lift investor sentiment—even as the U.S.-China trade relationship showed renewed signs of strain.
Let’s dive into what moved the markets this week and what’s coming up next!
🌍 Market Overview: Relief Rally… But Trade Tensions Simmer
US equities opened the week with a bang after President Trump delayed the 50% tariff threat on EU goods, citing encouraging weekend talks. That optimism, however, would be short-lived as trade remained the central theme all week.
📌 Key Headlines Driving Market Action:
The S&P briefly surged toward 6,000 after the U.S. Court of International Trade blocked the April 2nd 'Liberation Day' tariffs, before an Appeals Court reinstated them hours later.
Treasury Secretary Bessent noted that talks with several partners remain active, but admitted U.S.-China negotiations have stalled.
Trump lashed out on Truth Social, accusing Beijing of violating the Switzerland handshake deal.
📉 Global Bond Relief:
Bond yields retreated, supporting equities. U.S. 10-year yields backed off 4.5%, while Japan’s talk of pulling back JGB issuance calmed global rate jitters.
May PCE inflation continued trending in the Fed’s preferred direction.
Crude oil slipped ahead of this weekend’s OPEC+ meeting, where a larger output hike may be on the table.
📊 Weekly Market Performance:
S&P 500: +1.9%
Dow Jones: +1.6%
Nasdaq: +2.0%
📈 Economic Recap
Inflation Check:
May PCE Inflation came in as expected, showing continued disinflation—welcome news for the Fed and markets.
Other Data Points:
Richmond Fed data & sentiment readings saw modest improvement.
Treasury auctions were well received—supporting bond prices.
The VIX popped to 20 on Friday amid U.S.-China tensions but remained in check overall.
💼 Corporate Highlights: Trade Headwinds Meet Strong Demand
🧠 Tech & AI:
Nvidia ($NVDA):
Took an $8B hit on H20 chips due to export restrictions but still beat estimates on robust global AI demand. CEO Jensen Huang warned that U.S. policy may be weakening domestic tech competitiveness.
HP Inc ($HPQ):
Missed on top and bottom lines; cut guidance due to macro uncertainty.
Synopsys & Cadence:
Shares slid after Trump's new China sales restrictions hit the broader chip design space.
🛍️ Retail Rundown:
Macy’s ($M): Beat but cut guidance, citing tariff concerns and soft consumer discretionary trends.
Abercrombie & Fitch ($ANF):
Stock surged on better-than-expected Q1, led by Hollister’s 22% sales growth, despite ongoing tariff commentary.
Gap ($GPS):
Beat estimates, but shares fell 20% on no guidance raise, even with 2% same-store sales growth.
💸 M&A & Deal News:
Salesforce ($CRM):
Confirmed $8B acquisition of Informatica, strengthening its data cloud capabilities.
e.l.f. Beauty ($ELF):
Shares rallied on a $1B deal for Hailey Bieber’s ‘rhode’ beauty brand.
🔮 What’s Ahead (June 2–7):
Here’s your Week Ahead Watchlist 👇
Monday:
📊 ISM Manufacturing PMI
🎙️ Fed Chair Powell Speech
Tuesday:
📈 JOLTS Job Openings
Wednesday:
📊 ADP Payrolls
📊 ISM Services PMI
Thursday:
📉 Initial Jobless Claims
💼 Earnings: Broadcom $AVGO
Friday:
📊 U.S. Jobs Report (Nonfarm Payrolls)
🧭 Investor Takeaway:
While Nvidia’s resilience and PCE data gave bulls confidence, escalating U.S.-China friction and legal volatility around tariffs remind us just how fragile this environment remains. Markets want clarity—but policy and geopolitics keep delivering noise.
🧠 Keep watching bond yields, trade headlines, and AI leadership names for signals on the next leg of this rally.
💬 Question of the Week:
If the Supreme Court strikes down Trump’s tariff authority, what asset class stands to gain the most—Tech, Treasuries, or Commodities?
👉 Cast your vote in the Discord and tell us why!
📝 From the Editor
Markets were buffeted by a tsunami of macro headlines last week, keeping volatility front and center. After tagging our $5,770 MOB zone, SPX pulled back to reset RSI—but with global trade headlines in flux, Tuesday could bring a relief bounce.
The US-China truce looks increasingly fragile, with new tech export restrictions and rare earth disputes threatening to reignite tensions. Meanwhile, Europe weighs a 50% auto tariff, though chatter of delays and ongoing talks is providing some hope.
The Fed remains in focus: PCE data came in tame, but FOMC minutes and Fed speak reflected deep concern about shifting global correlations and safe-haven flows. Add in dovish surprises from South Korea and South Africa, and you get a picture of a world grappling with slowing growth.
On the corporate front, NVIDIA blew past expectations, but warned about AI ch
– The DIYWallSt Team
Market Forecast (Updated 06/01/2025)
SPX - Market started losing steam again as we head toward the weekend, data are showing that the housing market is really weak and that could signal that the economy is weak overall, But the GDP projection is now projecting expansion if there's no tariff, so that means the economy should be strong.
Next resistance: $5,970 and $6,120
Next support: $5,770, and $5,655
Weekly Sentiment: Mixed
Chart Analysis: TVC:DXY Chart Image by WallSt007

DXY - With GDP expansion based on recent projects, we could see buyers come in again. As long as there's no movements in the tariff side, we should be okay.
Next resistance: $101.25
Next support: $97.40
Weekly Sentiment: mixed
Put to call Ratio: 1.05—>1.19—> 1.49
Next FOMC date: 06/17/2025
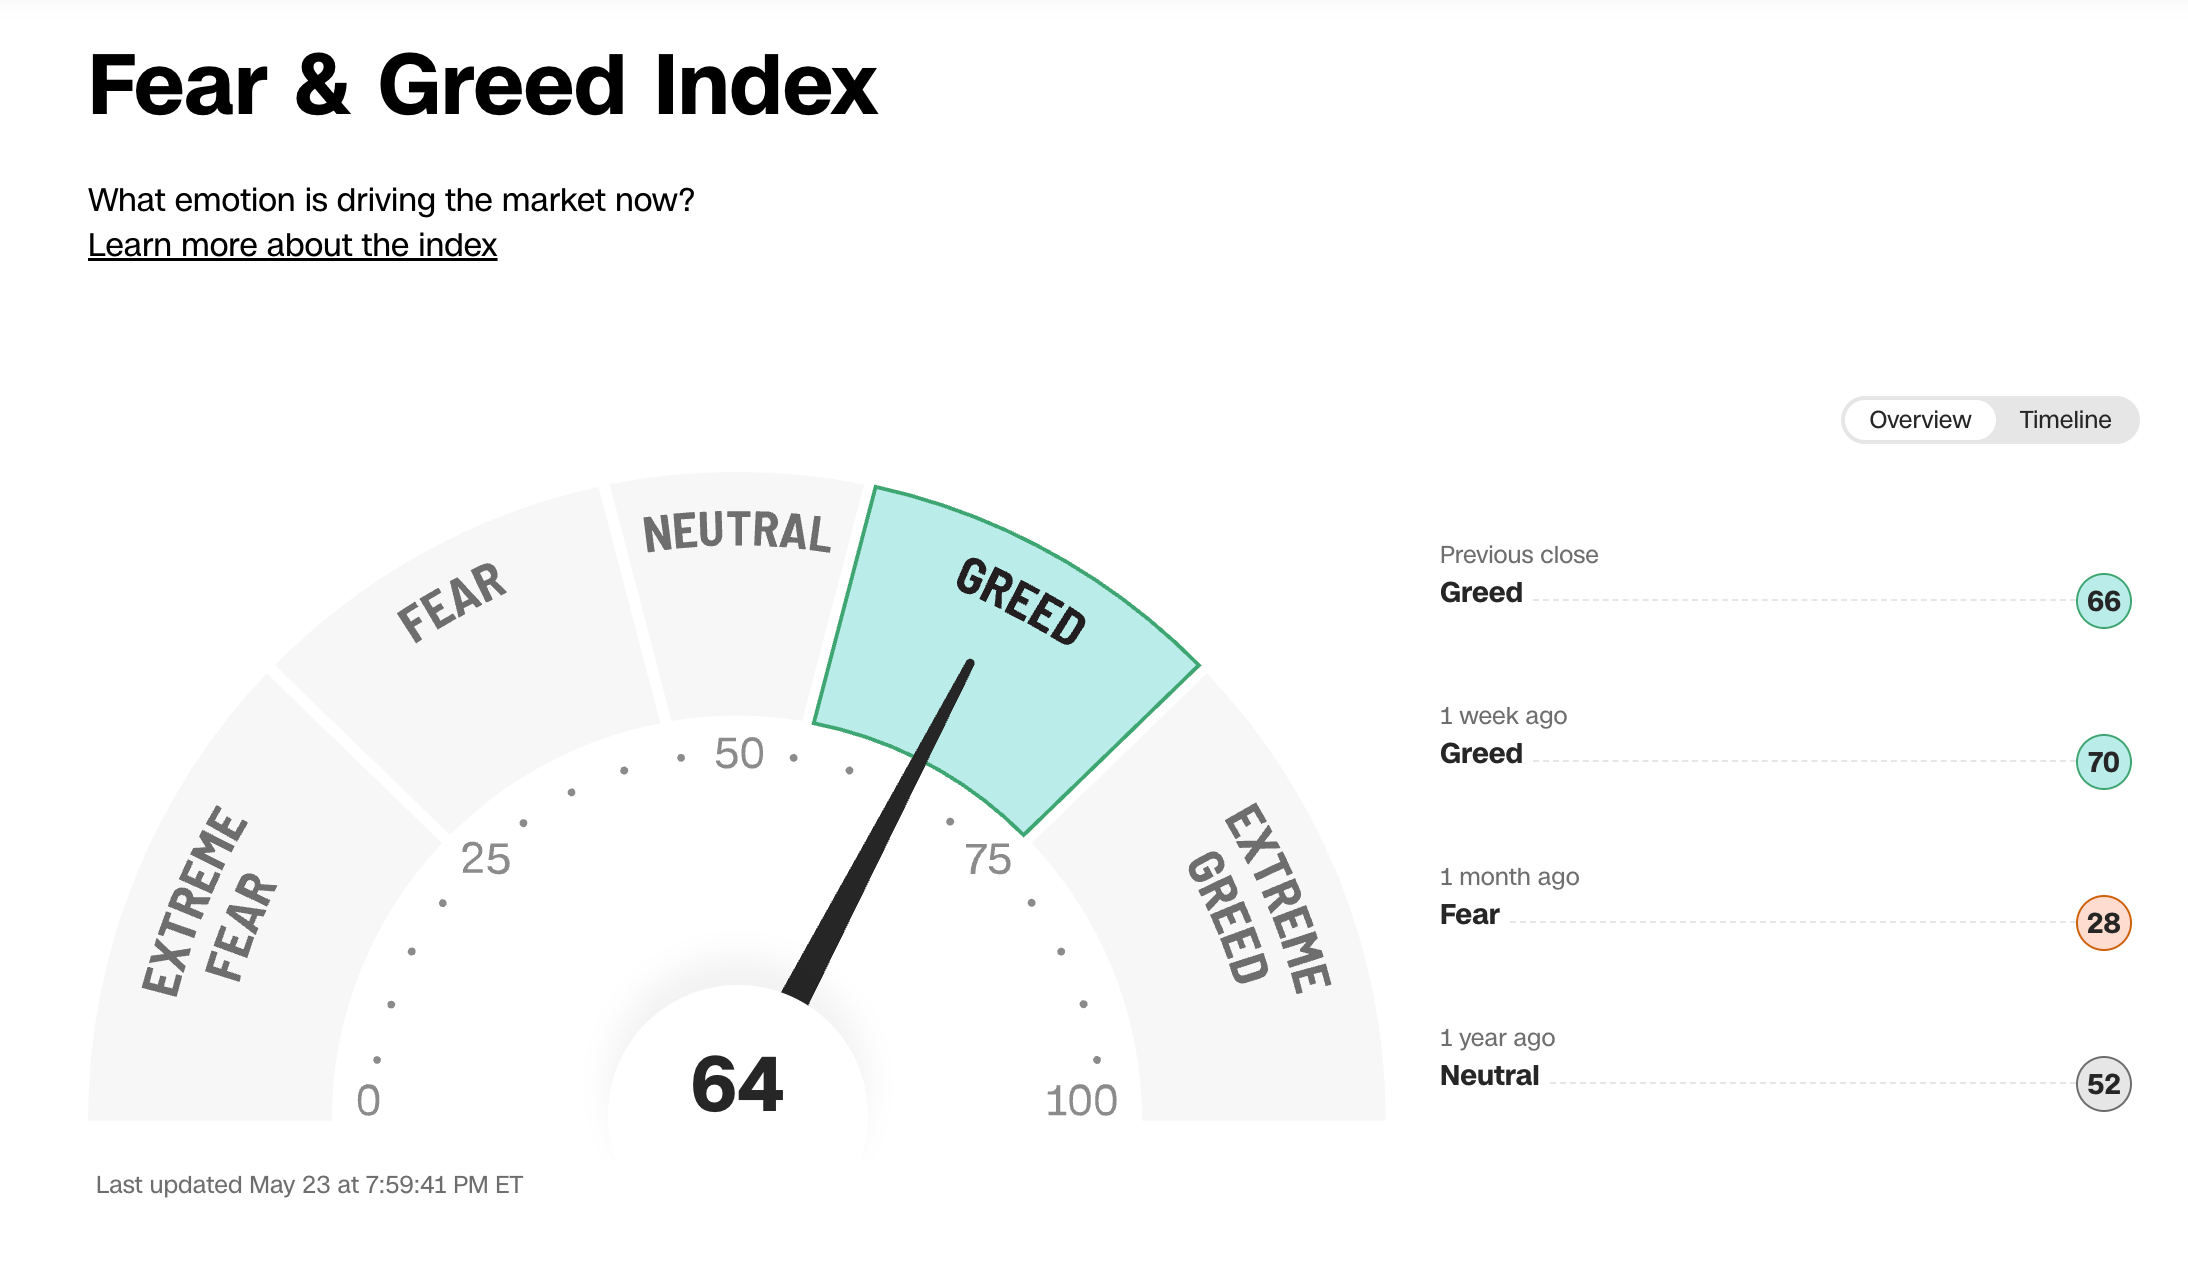
Fear & Greed Index: 62—>71—>64 (Under 25 is extreme fear)
BTC:Bitcoin is at oversold zone again, and has busted through all our resistance so far. it has reunited with it's trend of following Gold and inversing the dollar again. If this continues we could see it touch 150k to 200k this year.
Next Major Resistance: 111k
Next Support: 95k and 77k.
BTC Chart: BINANCE:BTCUSD Chart Image by WallSt007

Undervalued Stock Watchlist(updated 5/26/2025): Stocks on our radar due to their potential value include: X10: AGCO, ALB, BAC, BIPC, CADE, CBU, CPK, FCNCA, FFIN, FMBH, GOOG, GOOGL, GRC, IRM, KIM, NPO, NXRT, OBK, PB, PFS, PHG, RNST, UMBF, URI, WBS, WDC, WT
X20: EE, KNTK, OKE, PAA, LILA, WRD, G, HCKT, HSTM, KRYS, LNTH, MESO, OKE, PAGP, MDT, NKE, SBLK. WMK
Swing Trading watchlist: Get a detailed view here.
Weekly Undervalued Stock Picks
CACI International, Inc. operates as holding company, which engages in the provision of information solutions and services in support of national security missions and government transformation for intelligence, defense, and federal civilian customers. It operates through the Domestic Operations and International Operations segment. The Domestic Operations segment offers information solutions and services to U.S. federal government agencies, state and local governments, and commercial enterprises to different market areas, including business systems, command and control, communications, cyber security, enterprise information technology (IT), health, intelligence services, investigation and litigation support, logistics and material readiness, and surveillance and reconnaissance. The International Operations segment includes the provision of IT services and proprietary data and software products, serving commercial and government customers.
Buy: $341
Sell: $391
Stoploss: $291

PAA: Plains All American Pipeline LP engages in the operation of midstream energy infrastructure and provides logistics services for crude oil, natural gas liquids, and natural gas. It operates through the Crude Oil and Natural Gas Liquids (NGL) segments. The Crude Oil segment refers to the pipeline transportation, terminalling, storage, and gathering assets. The NGL segment produces basins and transportation corridors. The company was founded by Greg L. Armstrong in 1998 and is headquartered in Houston, TX.
Buy: $14.25
Sell: $15.25
Stoploss: $13.25

Lululemon Athletica Inc. (NASDAQ: LULU) is a Canadian athletic apparel company that designs and sells performance wear for yoga, running, training, and casual use. Headquartered in Vancouver, the company operates hundreds of retail stores globally and also sells through its eCommerce platform. Lululemon is known for its premium fabrics, community-focused brand, and loyal customer base.
Buy: $316.60
Sell: $345
Stoploss: $288


Key Economic & Earnings Events for This Week: We moved this section to our trading corner that’s updated daily. 007ofWallSt Trading Corner
Quick Financial Glossary:
Overbought Sentiment: Imagine a product getting too popular, too fast. This might hint that its popularity could soon fade.
Oversold Market: Think of it as a fantastic product being ignored by many. Chances are, it'll soon catch everyone's eye and gain value.
Support: Picture it as a safety net under a trapeze artist. It's a level where a stock tends to stop falling, based on past performance.
Resistance: Think of this as a ceiling in a room. It's a level that a stock struggles to exceed, based on its history.
SPX (S&P 500 Index): This is like the leaderboard of the American stock market, showing the performance of 500 large companies listed on stock exchanges in the United States. It's often used as a thermometer for the overall health of the US stock market and economy.
DXY (US Dollar Index): Imagine it as a scorecard that tells us how strong the US dollar is compared to a basket of other currencies. It's like a report card for the US dollar's value on the global stage.