DIYWallST Weekly Recap & Market Forecast $SPX (June 15th—> June 20th)
Stock Market Outlooks, Earning Calendars, WallStreetBets, Economic Calendar, Stock Market Recap, $SPX, Crypto, BTC, DIY Investing
👋 Hello Investors! 🌟
Another week of volatility, but the bulls are holding steady! The S&P is creeping closer to all-time highs, buoyed by positive data and trade developments, though some risks still lurk beneath the surface. From easing inflation to geopolitical tensions, it’s been a mixed bag. Let’s break down what moved the markets this week and what’s on the horizon for next week!
📈 Market Overview: Constructive Data, But Growing Concerns
This week, markets were driven by a mix of positive inflation data and constructive trade talks that gave investors reason to stay optimistic—at least for now.
🔑 Key Developments:
Inflation cooled: Both May PPI and CPI undershot expectations, adding fuel to the Fed’s dovish case for potential rate cuts later this year.
Sentiment surged: The University of Michigan sentiment index posted its first improvement in six months, rising above 60. Additionally, inflation expectations fell from the highs seen after Trump’s April tariff announcement.
Trade progress: U.S. and China officials held constructive talks in London, with both sides hopeful about the de-escalation measures agreed upon last month in Geneva.
🚨 Still Some Risk Factors:
Growth concerns are rising: Jobless claims approached 250K for the second week in a row, signaling potential strain in the labor market.
Fiscal uncertainty: The GOP tax/spending bill remains stuck, and the debt ceiling deadline looms large, creating more stress on the economy’s trajectory.
Geopolitical risks surged: Israel’s attack on Iran’s nuclear facilities escalated tensions, sending oil and gold prices higher but those gains were short-lived.
📉 Market Performance:
S&P 500: -0.4%
DJIA: -1.3%
Nasdaq: -0.6%
🧠 Economic Highlights:
Inflation Data: PPI and CPI both came in lower than expected, signaling potential for continued disinflation—but tariff impacts remain to be seen.
Jobless Claims: The steady rise in initial claims has investors on alert, with a key focus on whether the labor market can stay resilient.
U.S.-China Trade Talks: A possible face-to-face meeting could be on the horizon, though details remain vague, and markets are cautious.
Geopolitical Risks: The Middle East saw escalation with Israel’s attack on Iran, driving short-term oil and gold price spikes.
Fed Watch: Fed Chairman Powell continues to suggest no imminent rate cuts, though the dovish tone in the market persists.
💼 Corporate News: Mixed Results Amid Turmoil
Despite geopolitical turbulence, corporate earnings and developments continued to capture attention:
Oracle ($ORCL): Reported a strong quarter, with AI demand continuing to outstrip supply, which gave a boost to tech stocks.
Apple ($AAPL): Hosted its annual developer conference, unveiling incremental updates but withholding major Siri AI upgrades until next year.
Air India Incident: The tragic crash of an Air India 787 marked the first fatal accident for the model, weighing heavily on Boeing ($BA) stock.
IPOs: Chime and Voyager both launched with success, with Chime opening 60% above its IPO price and Voyager doubling its initial value.
🔮 Looking Ahead:
Next week’s agenda is packed with economic data and earnings reports, so buckle up!
Here Are My #Top5ThingsToKnow This Week:
Fed Rate Decision: Will the Fed hold steady or hint at a potential cut?
FOMC Dot-Plot & Powell Speech: Insights into future monetary policy.
U.S. Retail Sales: Key data on consumer spending.
Market close on Thursday for Juneteenth.
Earnings: $LEN (Lennar), $JBL (Jabil), and $KR (Kroger) report this week.
💬 Question of the Week:
What’s your outlook on inflation moving forward—are we on track for sustained disinflation, or is this just a temporary blip?
👉 Join the conversation in Discord and let us know your thoughts!
—
📝 From the Editor
What no one really wants to talk about right now is the escalating conflict with Iran. This didn’t feel random — it was a deliberate and aggressive move, and it's hard to see a way for Iran to back down unless they’re certain they can’t win. I don’t think that’s where we’re at.
My take? This conflict drags on longer than most expect. We’ve already seen oil and gold creeping higher for months, and I think that continues — especially oil. That’s exactly why we’ve been positioning into oil stocks over the past 2–3 months in our long-term portfolio.
I could be wrong, but this is what I’m watching closely right now.
– The DIYWallSt Team
Market Forecast (Updated 06/15/2025)
SPX - As uncertainty increases, people tend to risk off and reduce position. The chart is also showing bearish signals.
Next resistance: $6,150
Next support: $5,780, and $5,510
Weekly Sentiment: Bearish crossover
Chart Analysis: TVC:DXY Chart Image by WallSt007
DXY - With Fomc meeting coming up this week, We should see the dollar gaining strengeth again as long as they keep the rates steady.
Next resistance: $99.20
Next support: $97.40
Weekly Sentiment: Oversold
Put to call Ratio: 1.19—>1.49—> 1.26—>1.74 —>1.71
Next FOMC date: 06/18/2025
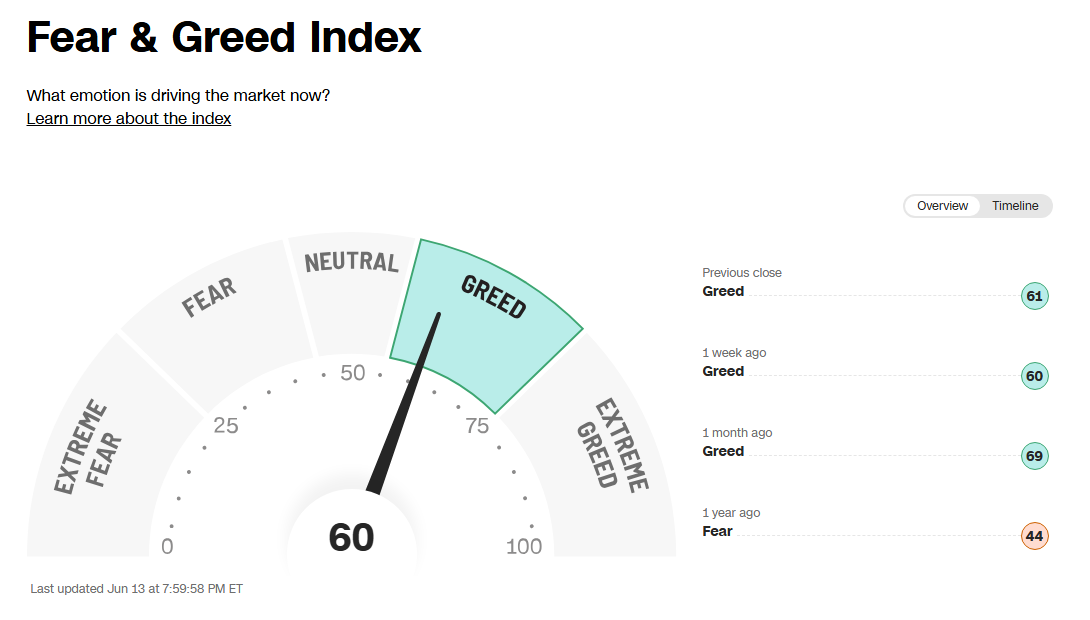
Fear & Greed Index: 71—>64—>62—>63—>60 (Under 25 is extreme fear)
BTC: Bitcoin is starting to lose momentum and this means we could go back to the previous support such as 95k or 77 as uncertainty in the world increases with wars and protests.
Next Major Resistance: 111k
Next Support: 95k and 77k.
BTC Chart: BINANCE:BTCUSD Chart Image by WallSt007
Undervalued Stock Watchlist(updated 6/15/2025): Stocks on our radar due to their potential value include: X10: ALLE, ATEC, CASH, CBRL, CIEN, DRVN, EVTC, EW, FBP, FHN, FVRR, LUV, MCO, MSGE, RIVN, SKYW, VMC, ZWS, OKTA, UPWK
X20: EE, KNTK, OKE, LILA, WRD, HCKT, HSTM, KRYS, LNTH, MESO, OKE, PAGP, MDT, NKE, SBLK, G
Swing Trading watchlist: Get a detailed view here.
Weekly Undervalued Stock Picks
ZWS: Zurn Elkay Water Solutions Corp. engages in the design, procurement, manufacture, and sale of water solutions. It operates through the following geographical segments: United States, Canada, and Rest of World. The company was founded on February 24, 1892 and is headquartered in Milwaukee, WI.
Buy: $29.75
Sell: $32
Stoploss: $27.50
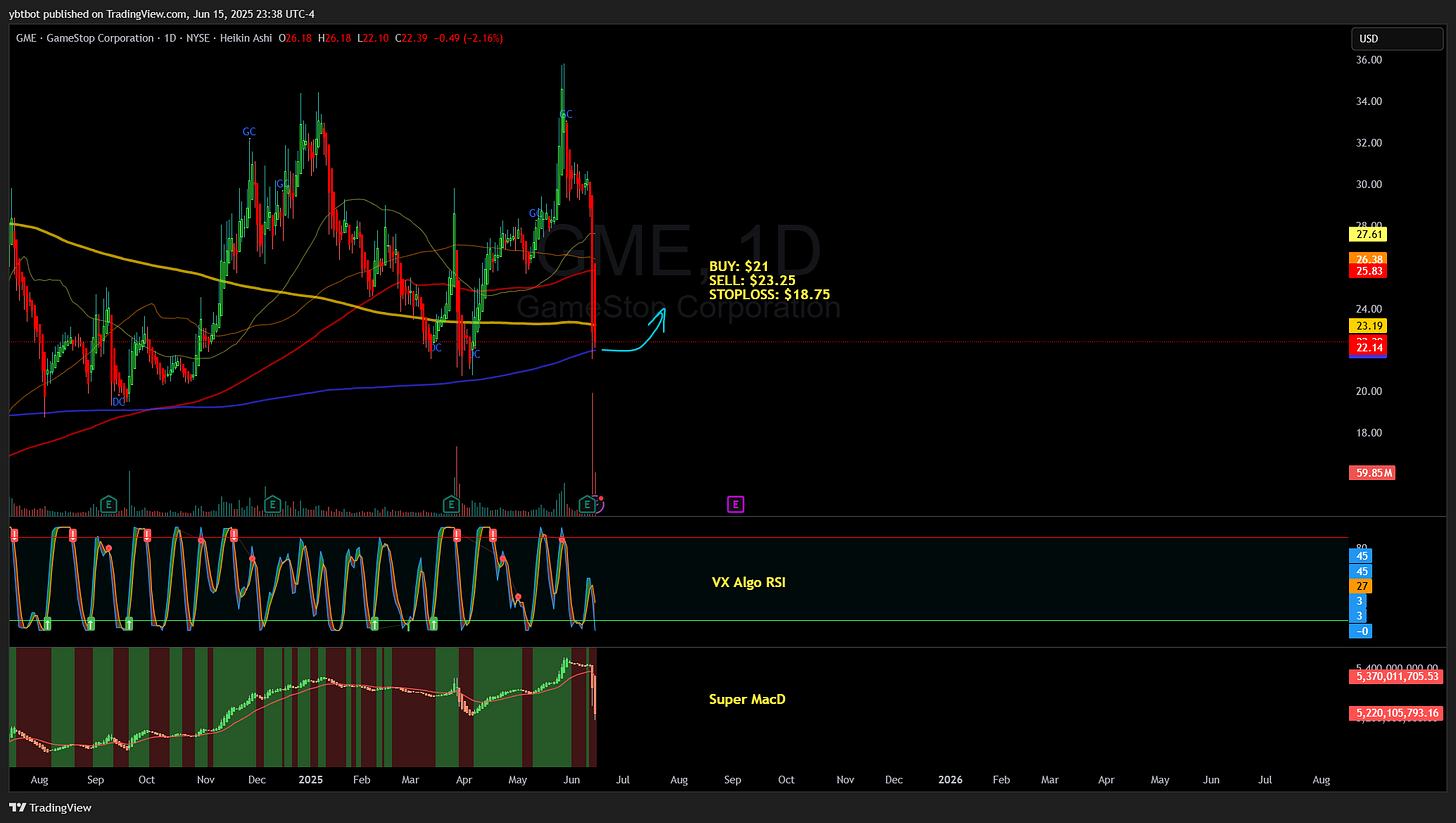
GME: GameStop Corp. engages in offering games and entertainment products through its ecommerce properties and stores. The firm’s stores and ecommerce sites operate primarily under the names GameStop, EB Games, and Micromania. It operates through the following geographical segments: United States, Canada, Australia, and Europe. The company was founded by Daniel A. DeMatteo in 1996 and is headquartered in Grapevine, TX.
Buy: $21
Sell: $23.25
Stoploss: $18.75
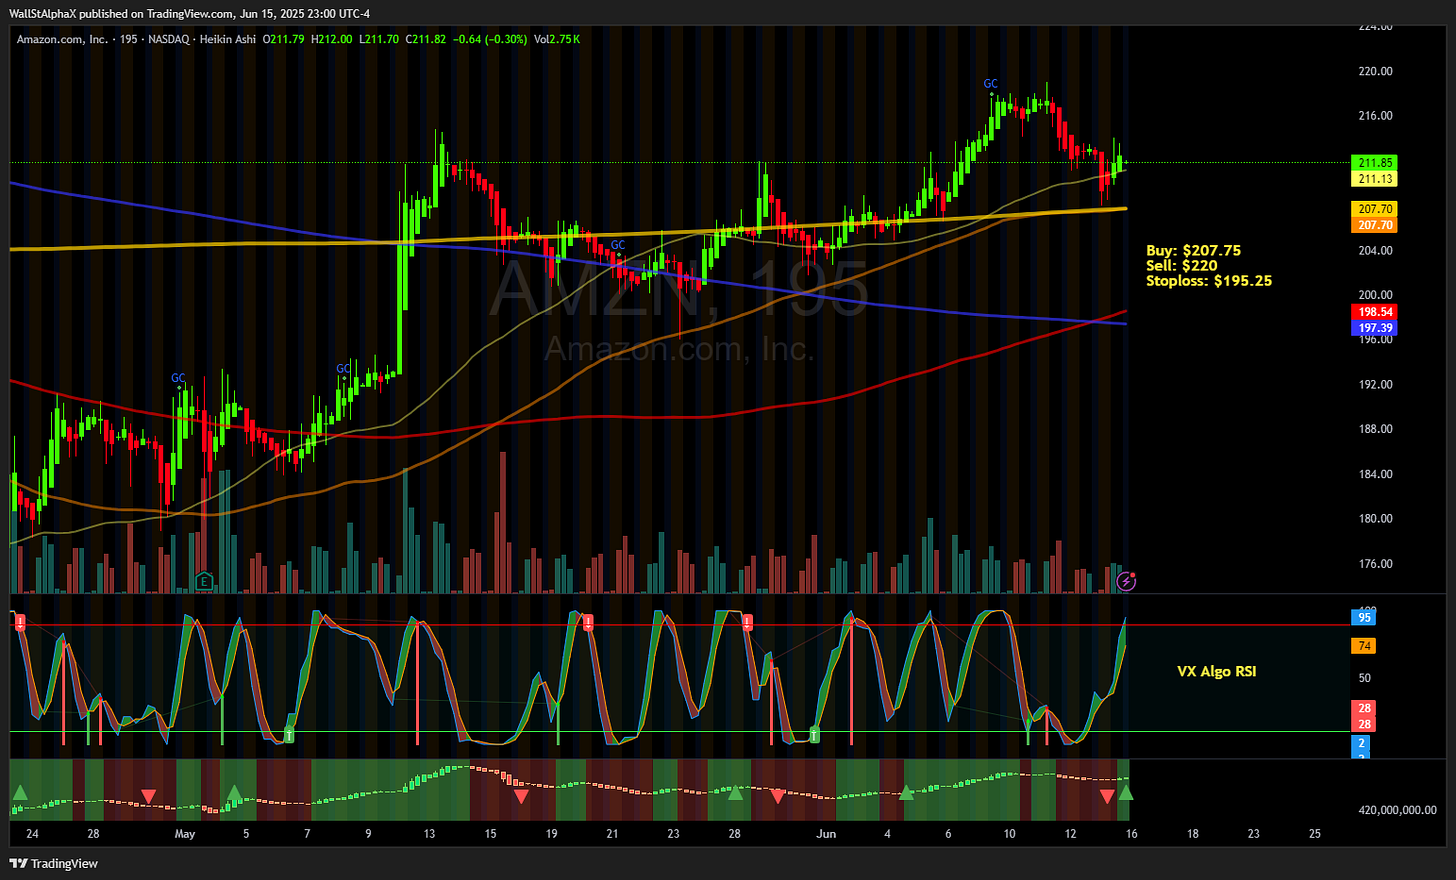
Amazon.com, Inc. (NASDAQ: AMZN) is a global technology and eCommerce company headquartered in Seattle, Washington. It operates the world’s largest online marketplace, along with services in cloud computing (AWS), digital streaming, and artificial intelligence. Amazon also owns brands like Whole Foods and develops consumer electronics such as Kindle and Alexa-enabled devices.
Buy: $207.75
Sell: $220
Stoploss: $195.25
Key Economic & Earnings Events for This Week: We moved this section to our trading corner that’s updated daily. 007ofWallSt Trading Corner
Quick Financial Glossary:
Overbought Sentiment: Imagine a product getting too popular, too fast. This might hint that its popularity could soon fade.
Oversold Market: Think of it as a fantastic product being ignored by many. Chances are, it'll soon catch everyone's eye and gain value.
Support: Picture it as a safety net under a trapeze artist. It's a level where a stock tends to stop falling, based on past performance.
Resistance: Think of this as a ceiling in a room. It's a level that a stock struggles to exceed, based on its history.
SPX (S&P 500 Index): This is like the leaderboard of the American stock market, showing the performance of 500 large companies listed on stock exchanges in the United States. It's often used as a thermometer for the overall health of the US stock market and economy.
DXY (US Dollar Index): Imagine it as a scorecard that tells us how strong the US dollar is compared to a basket of other currencies. It's like a report card for the US dollar's value on the global stage.


